
consistent shareholder returns
Tata Power drives progress for investors by ensuring consistent shareholder returns through strategic investments in sustainable growth, resulting in regular dividend payments and steady capital appreciation.


Investors
At Tata Power, we are strategically positioned to drive long-term investor returns by capitalising on existing and emerging opportunities, aligned with India’s growth aspirations. We are leveraging our balance sheet strength to increase our clean & green capacity, expand our transmission & distribution network, drive rooftop solar initiatives to foraying into energy storage solutions and new-age businesses that could be potential growth engines.
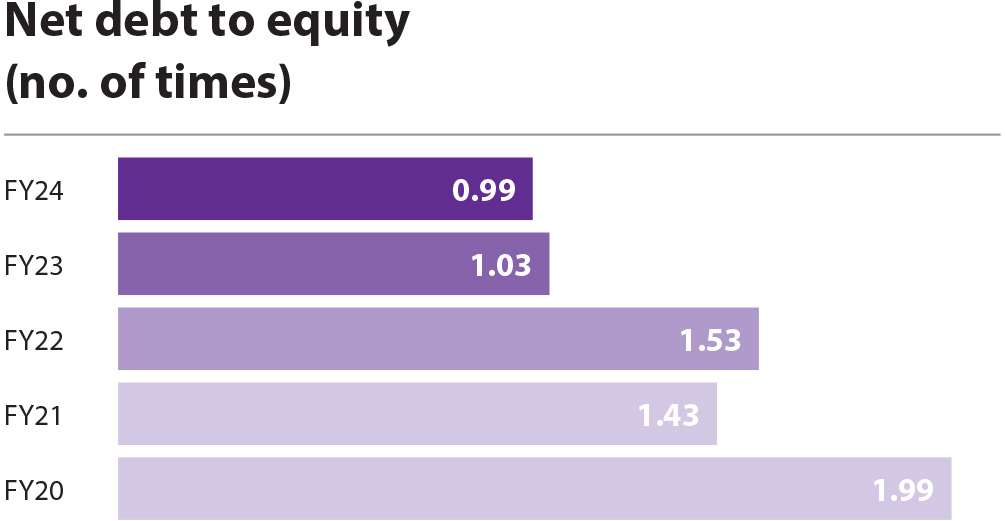
<1.5
Net debt/Equity target
>12%
RoE target
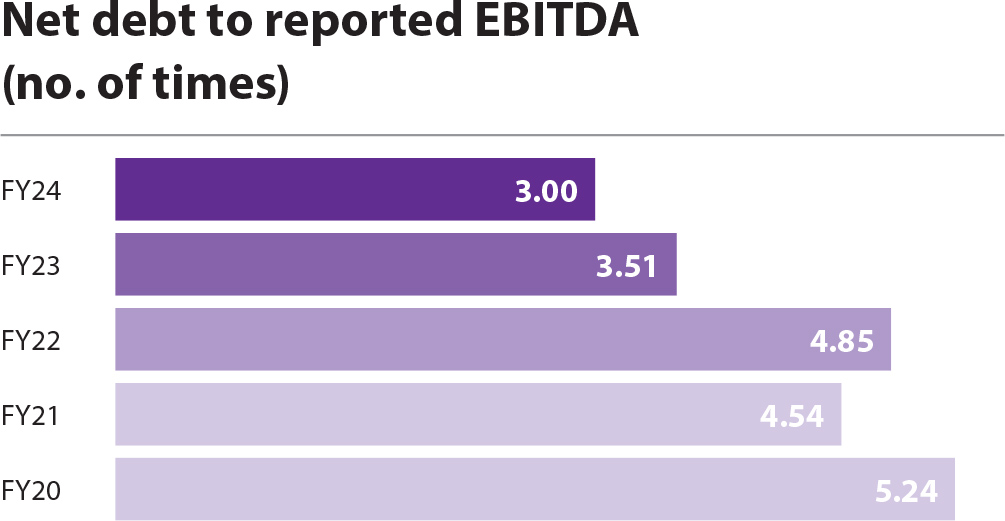
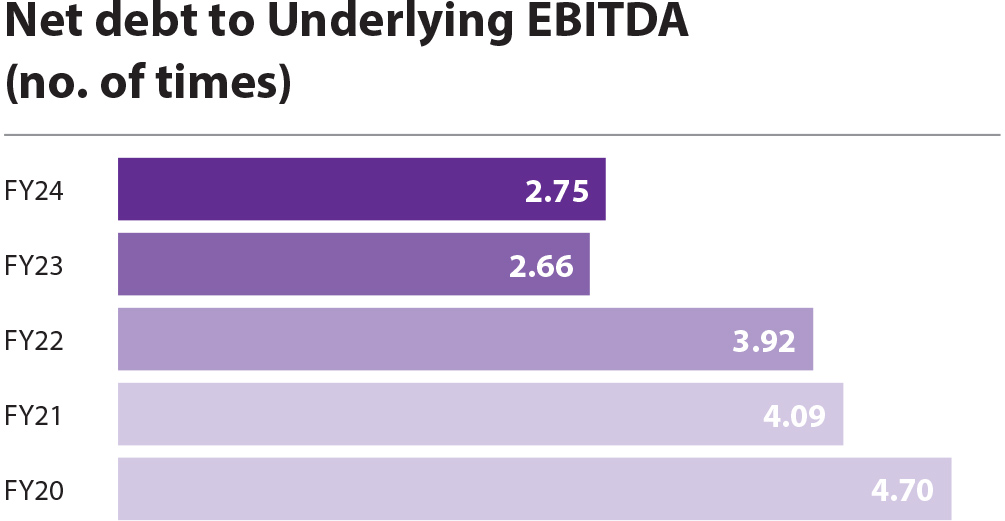
<3.5
Net debt/underlying EBITDA target
Involving shareholders in the carbon mitigation journey
- Striving to achieve 5-7% reduction in carbon intensity
- Focusing on viable technologies like storage technology (hydrogen) and carbon capture/ mitigation
Becoming the Utility of the Future
We aim to drive sustainable growth and establish market leadership through strategic objectives. We are well-positioned to become the Utility of the Future.
Aspirations
Leaping Profitability
2x growth in revenue, EBITDA, and PAT (FY23 base year)
RE-newing operations to achieve carbon net zero before 2045
- Expanding 5.8 GW Clean and Green portfolio to achieve >15 GW
- PSP Projects to add 2.8 GW to our Clean and Green portfolio
Leading the T&D landscape
Expand distribution footprint to 40 million customers; and grow transmission business through Tariff-Based Competitive Bidding (TBCB) and M&A
Investing in smart future
Installing 7.5+ lakh home chargers and 10,000+ EV charging points

Investor value creation
In FY24, Tata Power’s market capitalisation increased by 107%, marking the Company as the sixth entity within the Tata Group to exceed ₹ 1 trillion milestone. We prioritise fostering mutual understanding with our investors and are dedicated to creating value for them.
Pillars of value creation for investors
Providing strong earnings growth
Announced plans to increase revenues, EBITDA, and PAT by 2x (from FY23 base)
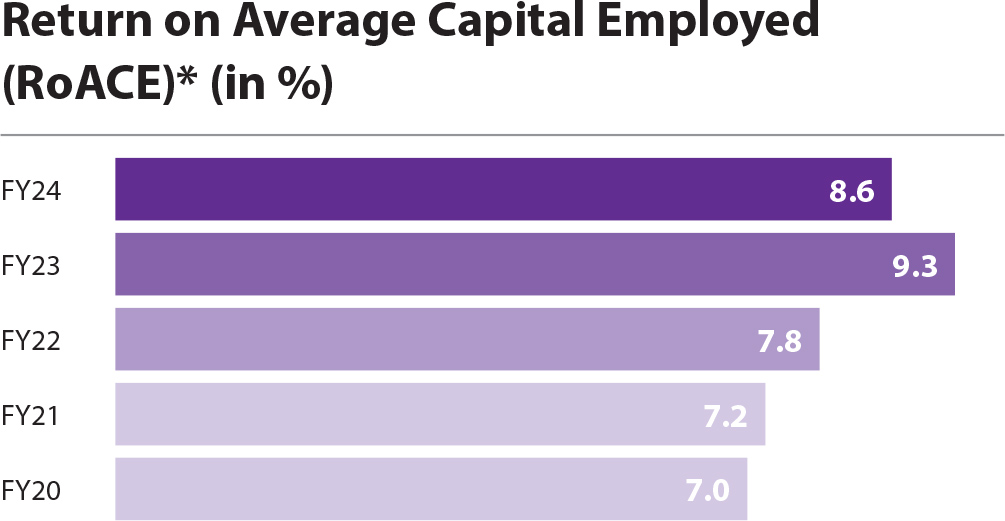
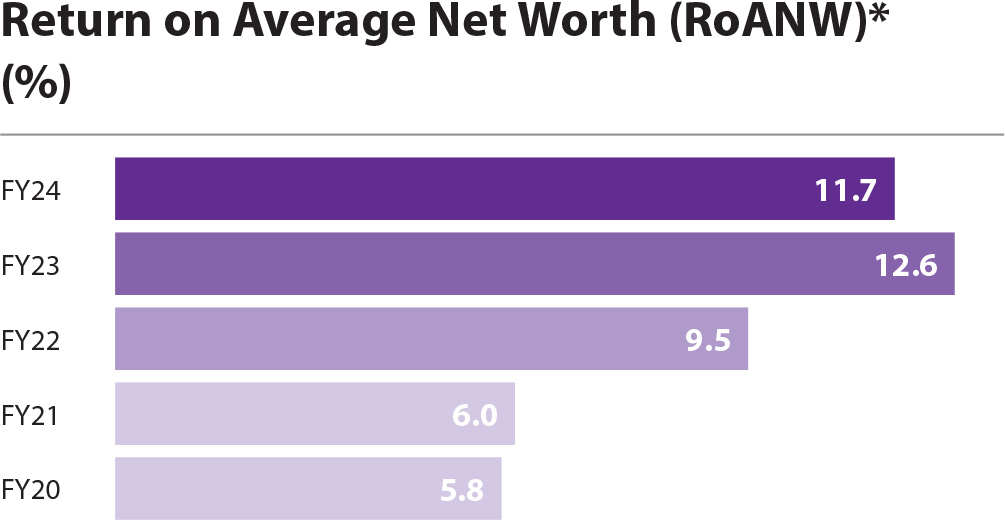
Improving ROEs
We are growing with targets set to improve returns for the shareholders. Target Return on Equity (ROE) > 12%
Maintaining strong balance sheet
We aim to maintain healthy leverage ratios, including net debt/ underlying EBITDA below 3.5x and net debt/equity below 1.5x, balancing growth without compromising our balance sheet strength
Focusing on business sustainability
Our long-term targets to become carbon net zero before 2045 and water neutral by 2030 showcase our commitment to sustainability
Managing financial capital and growth prospects
We are launching new projects and ventures that demand judicious management of our financial capital. By consistently investing in these initiatives, we maintain peak operational performance to fuel growth. Our financial resources are a mix of debt, equity, rising cash flows, and accruals, underpin these efforts. In line with our strategic objectives, we focus on maintaining a strong balance sheet and improving our return profile as we pursue growth.
597 MW
Capacity commissioned in FY24
40%
Share of clean and green capacity at the end of FY24
74%
Improved Share of Profit from Core Business (FY23-44%)
Growth
At Tata Power, we secure long-term shareholder returns by strategically capitalising on market potential and emerging opportunities.
Utilising advanced technology, we aim to expand our distribution network throughout India, enhancing rooftop solar capabilities and green energy solutions. As we transition to a brand-led, customer-centric organisation, we are developing low-carbon solutions including home automation and EV charging stations.
We have a total portfolio of 19.6 GW, including 4.9 GW of RE capacity under construction. Post the completion of capacity addition, our clean and green energy capacity will account for 55% of the total, from 40% at present. We aim to profitably scale up our clean and green capacity to 70% by 2030, and further 100% before 2045.

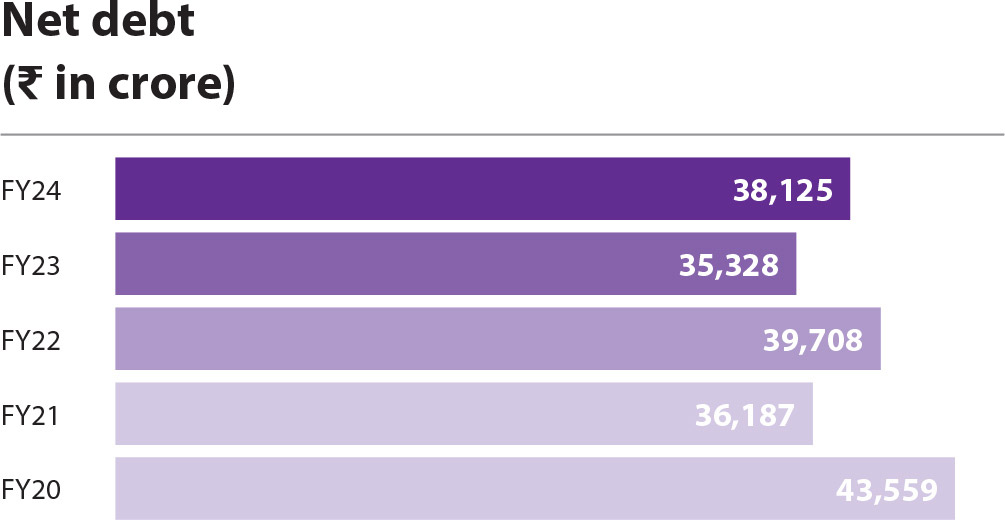
Strengthening balance sheet
We continue to strengthen our balance sheet while maintaining our financial leverage below the targeted levels, which provides significant room to drive sustainable growth over the medium and long term. This prudent capital management has resulted in a steady improvement in our credit ratings from both domestic and international rating agencies.
During the FY24, we maintained a stable debt profile, supported by robust cash flows from operations, a judicious approach to capital expenditure, and proceeds from divesting non-core assets. We continued to improve our balance sheet and achieved a comfortable net debt-to-EBITDA ratio of 3.51 in FY23, to 3.00 in FY24 on a consolidated basis.
Debt management
- Enhanced collection strategies: We have intensified efforts in customer collections, successfully accelerating the liquidation of receivables across all business units. This was facilitated by Government notifying the Late Payment Surcharge Rules which has enabled liquidation of outstanding dues and timely payments of the current dues.
- Improved working capital management: By negotiating extended supplier credit and utilising other trade finance structures, we have improved our credit terms, thereby enhancing cash flow.
- Optimisation for borrowing costs: We are actively refinancing / repricing high-cost debt to secure better repayment terms and reduce interest costs.
- Return on Average Net Worth (ROANW) before exceptional items % = PAT before exceptional items/ Average Equity
- Return on Average Net Capital Employed (RoACE) before exceptional items % = NOPAT/Average Capital employed
- Capital employed = Total Equity + Total Net Debt + lease liability
- NOPAT = PAT before exceptional items + finance costother income- tax shield on net finance cost
- Net Debt to Equity = Net Debt/Equity Net Debt = Total Debt - cash & cash equivalents - other bank balance - current investment - loan from related party
- Net Debt to Reported EBITDA = Net Debt/Earnings before Interest, Tax, Depreciation & Amortisation
- Net Debt to Underlying EBITDA = Net Debt/ (Earnings before Interest, Tax, Depreciation & Amortisation + Share of profit from JV & Associates)
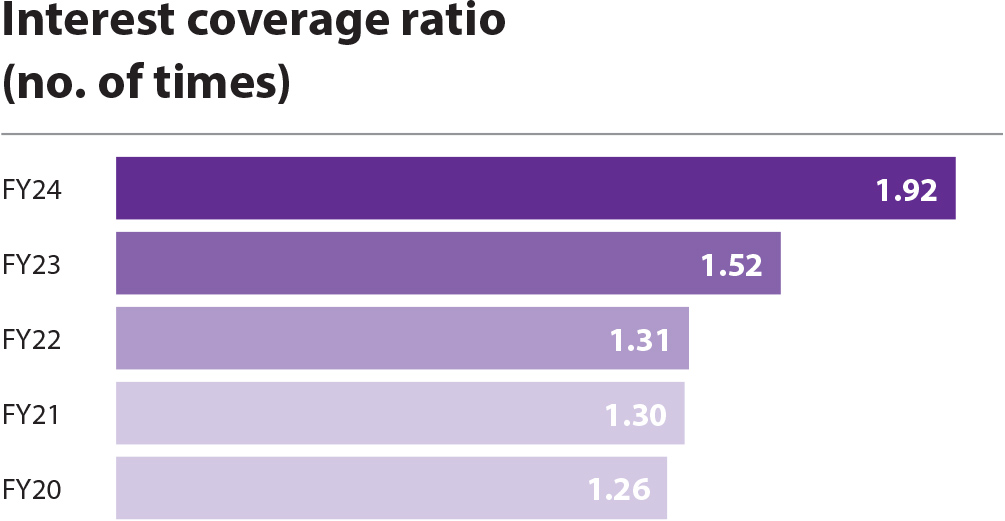
- Interest Coverage Ratio = Earnings before Interest and tax/Finance cost
Credit ratings
AA+/Stable↑
India ratings
AA/Positive ↑
CRISIL, CARE and ICRA
BB+/Stable
S&P Global
Ba1/Stable ↑
Moody’s

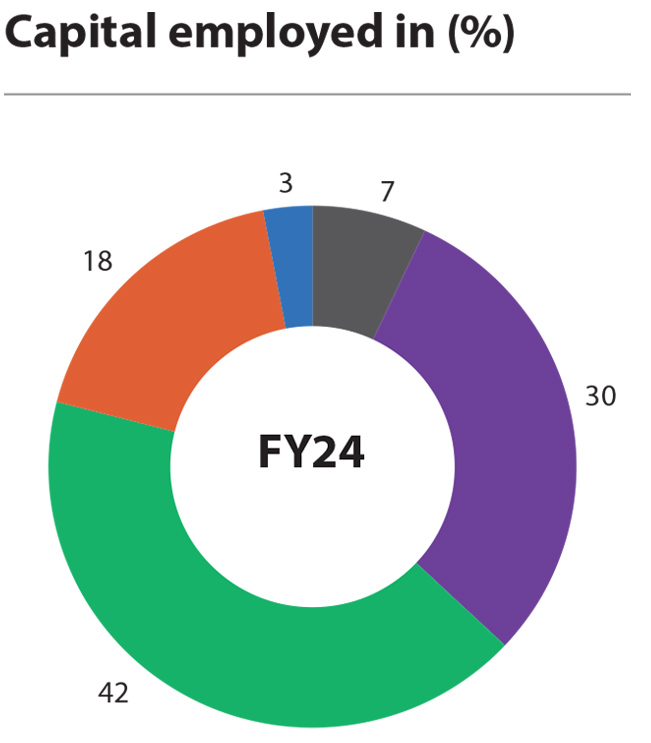
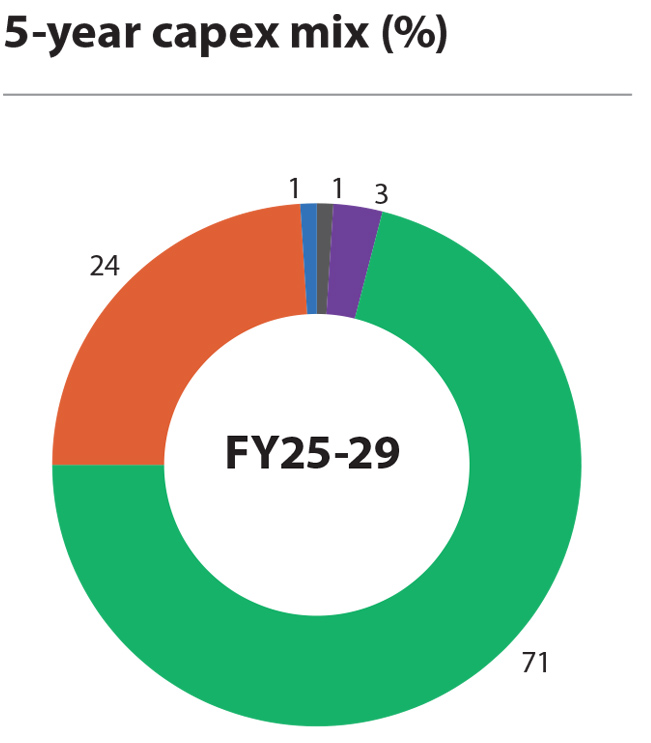
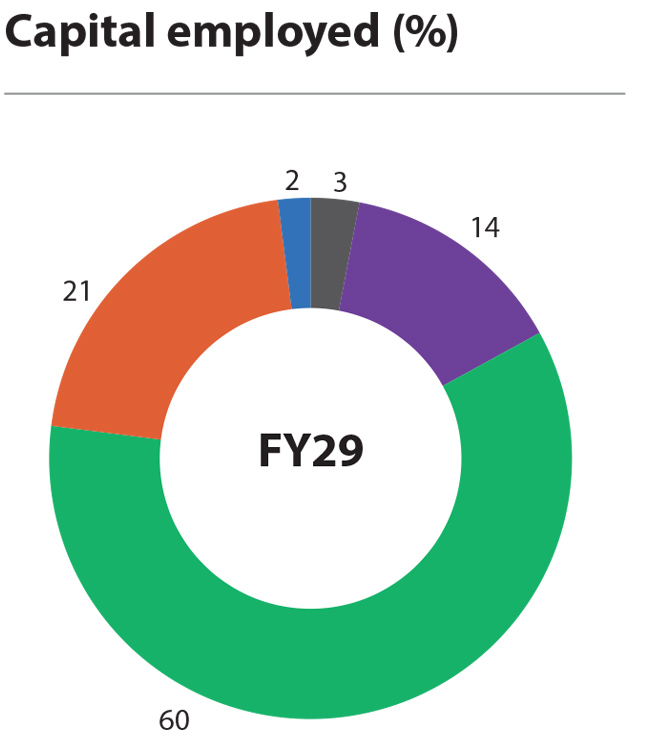
Reallocating capital employed
Prioritising sustainability, we are transitioning from traditional thermal operations to pioneering cleaner and greener solutions.


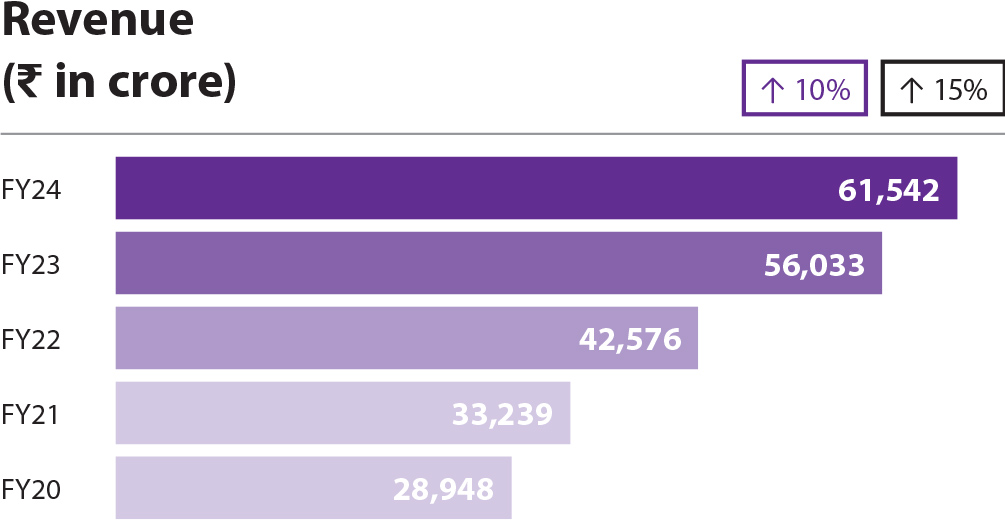
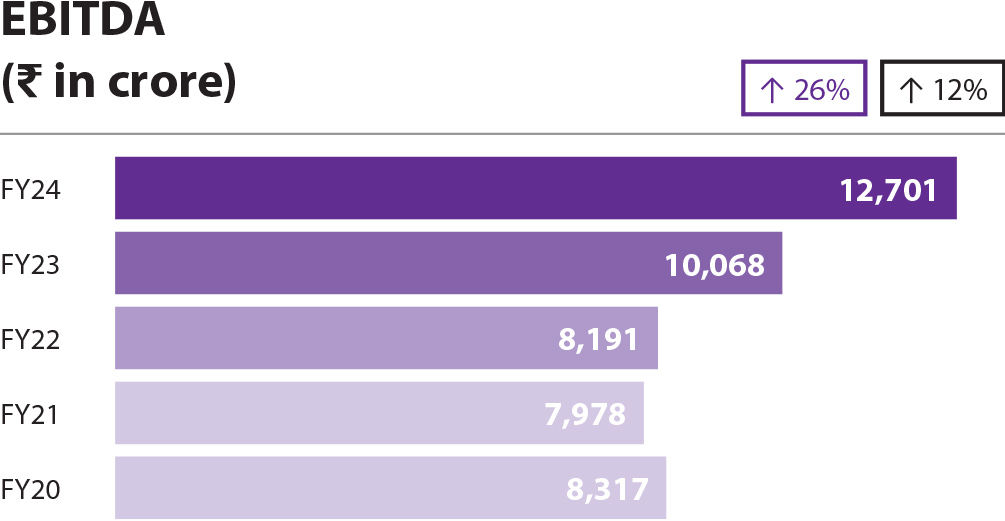
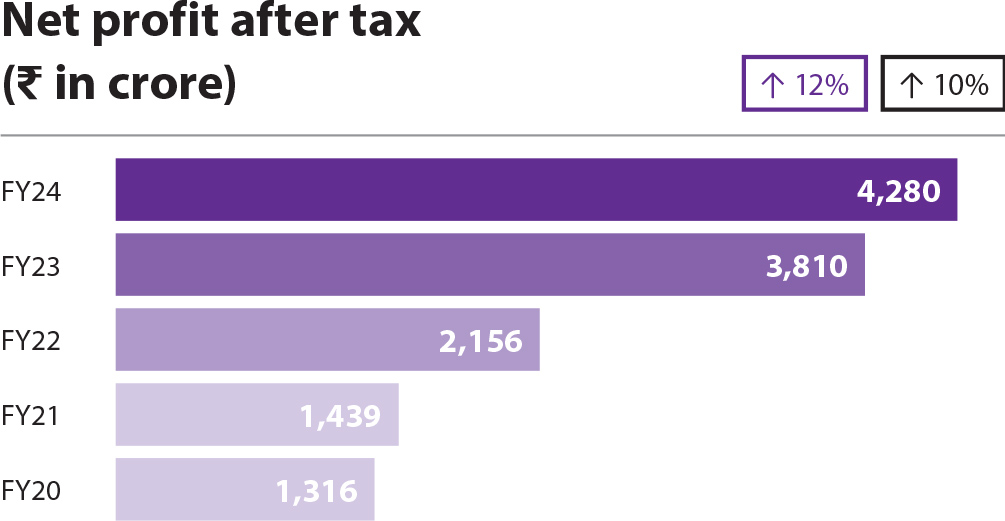
Strong financials reflect prudence and conviction
We demonstrated strong financial performance with steady growth in revenue and profitability with 18 consecutive quarters of PAT growth. Tata Power surpassed ₹ 1 trillion in market capitalisation and the Board recommended a dividend of ₹ 2 in FY24.
Key Performance Metrics

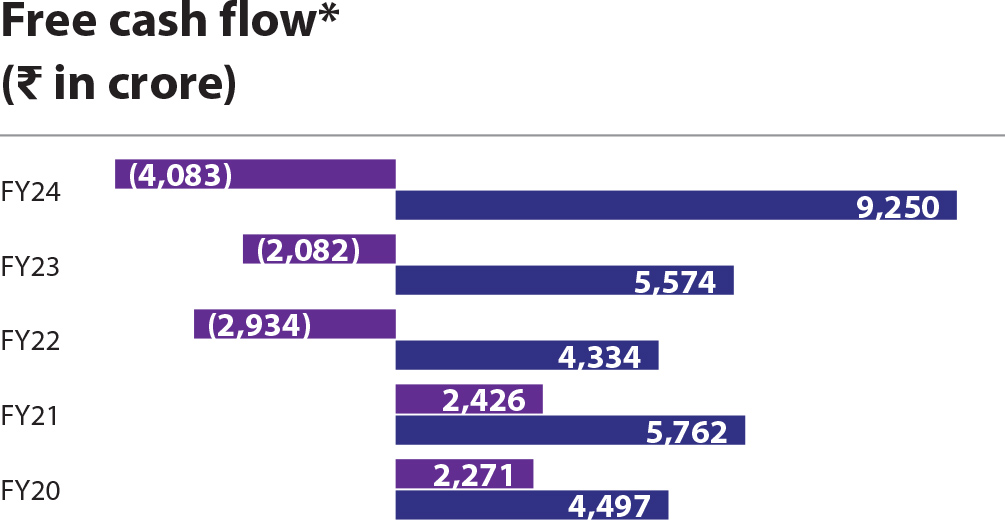

*Free cash flow = Cash from operating activity + dividend income – dividend paid – distribution on unsecured perpetual securities – interest paid - capex Note: The Management Discussion and Analysis section on page XX details more on financial performance of the Company
Economic value added
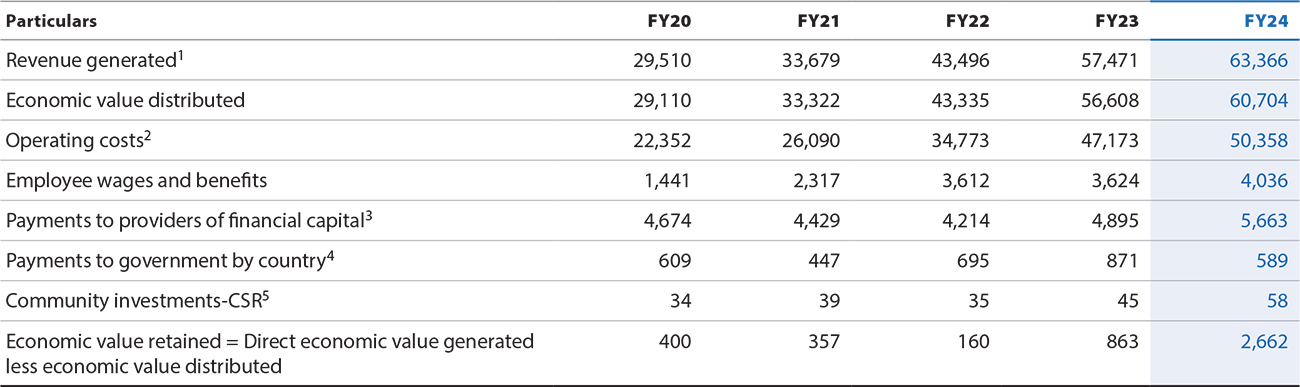
Notes:
- Revenue generated including other income and movement in regulatory deferral balance
- Operating cost including Cost of power purchased, Cost of Fuel, Transmission charges, Raw material consumed, Purchase of finished goods, increase/ decrease in WIP, depreciation & other expenses excluding CSR.
- Payment to providers of capital includes finance cost paid, dividend paid to shareholders & Distribution on Unsecured Perpetual Securities
- Payments to government by country include income tax paid (net of refund received)
- CSR includes both spent and unspent amount